GreenLedger
One sustainability report for a group of 21,000 people
We keep this client’s name private. The client is real, and so is the system.
- Client
- One of the Philippines’ largest infrastructure groups, with companies in power, water, toll roads, hospitals, and logistics
- Industry
- Infrastructure and Utilities
- Services
- Product Design, Web Development, Reporting Dashboards, Ongoing Support
About the client
The group runs services millions of Filipinos use every day: the country’s biggest electricity distributor, Metro Manila’s west-zone water company, major expressways in Luzon, and a large hospital network. Its group companies employ more than 21,000 people. In one quarter of 2025 alone, the group’s operating revenue was about ₱19 billion.
The challenge
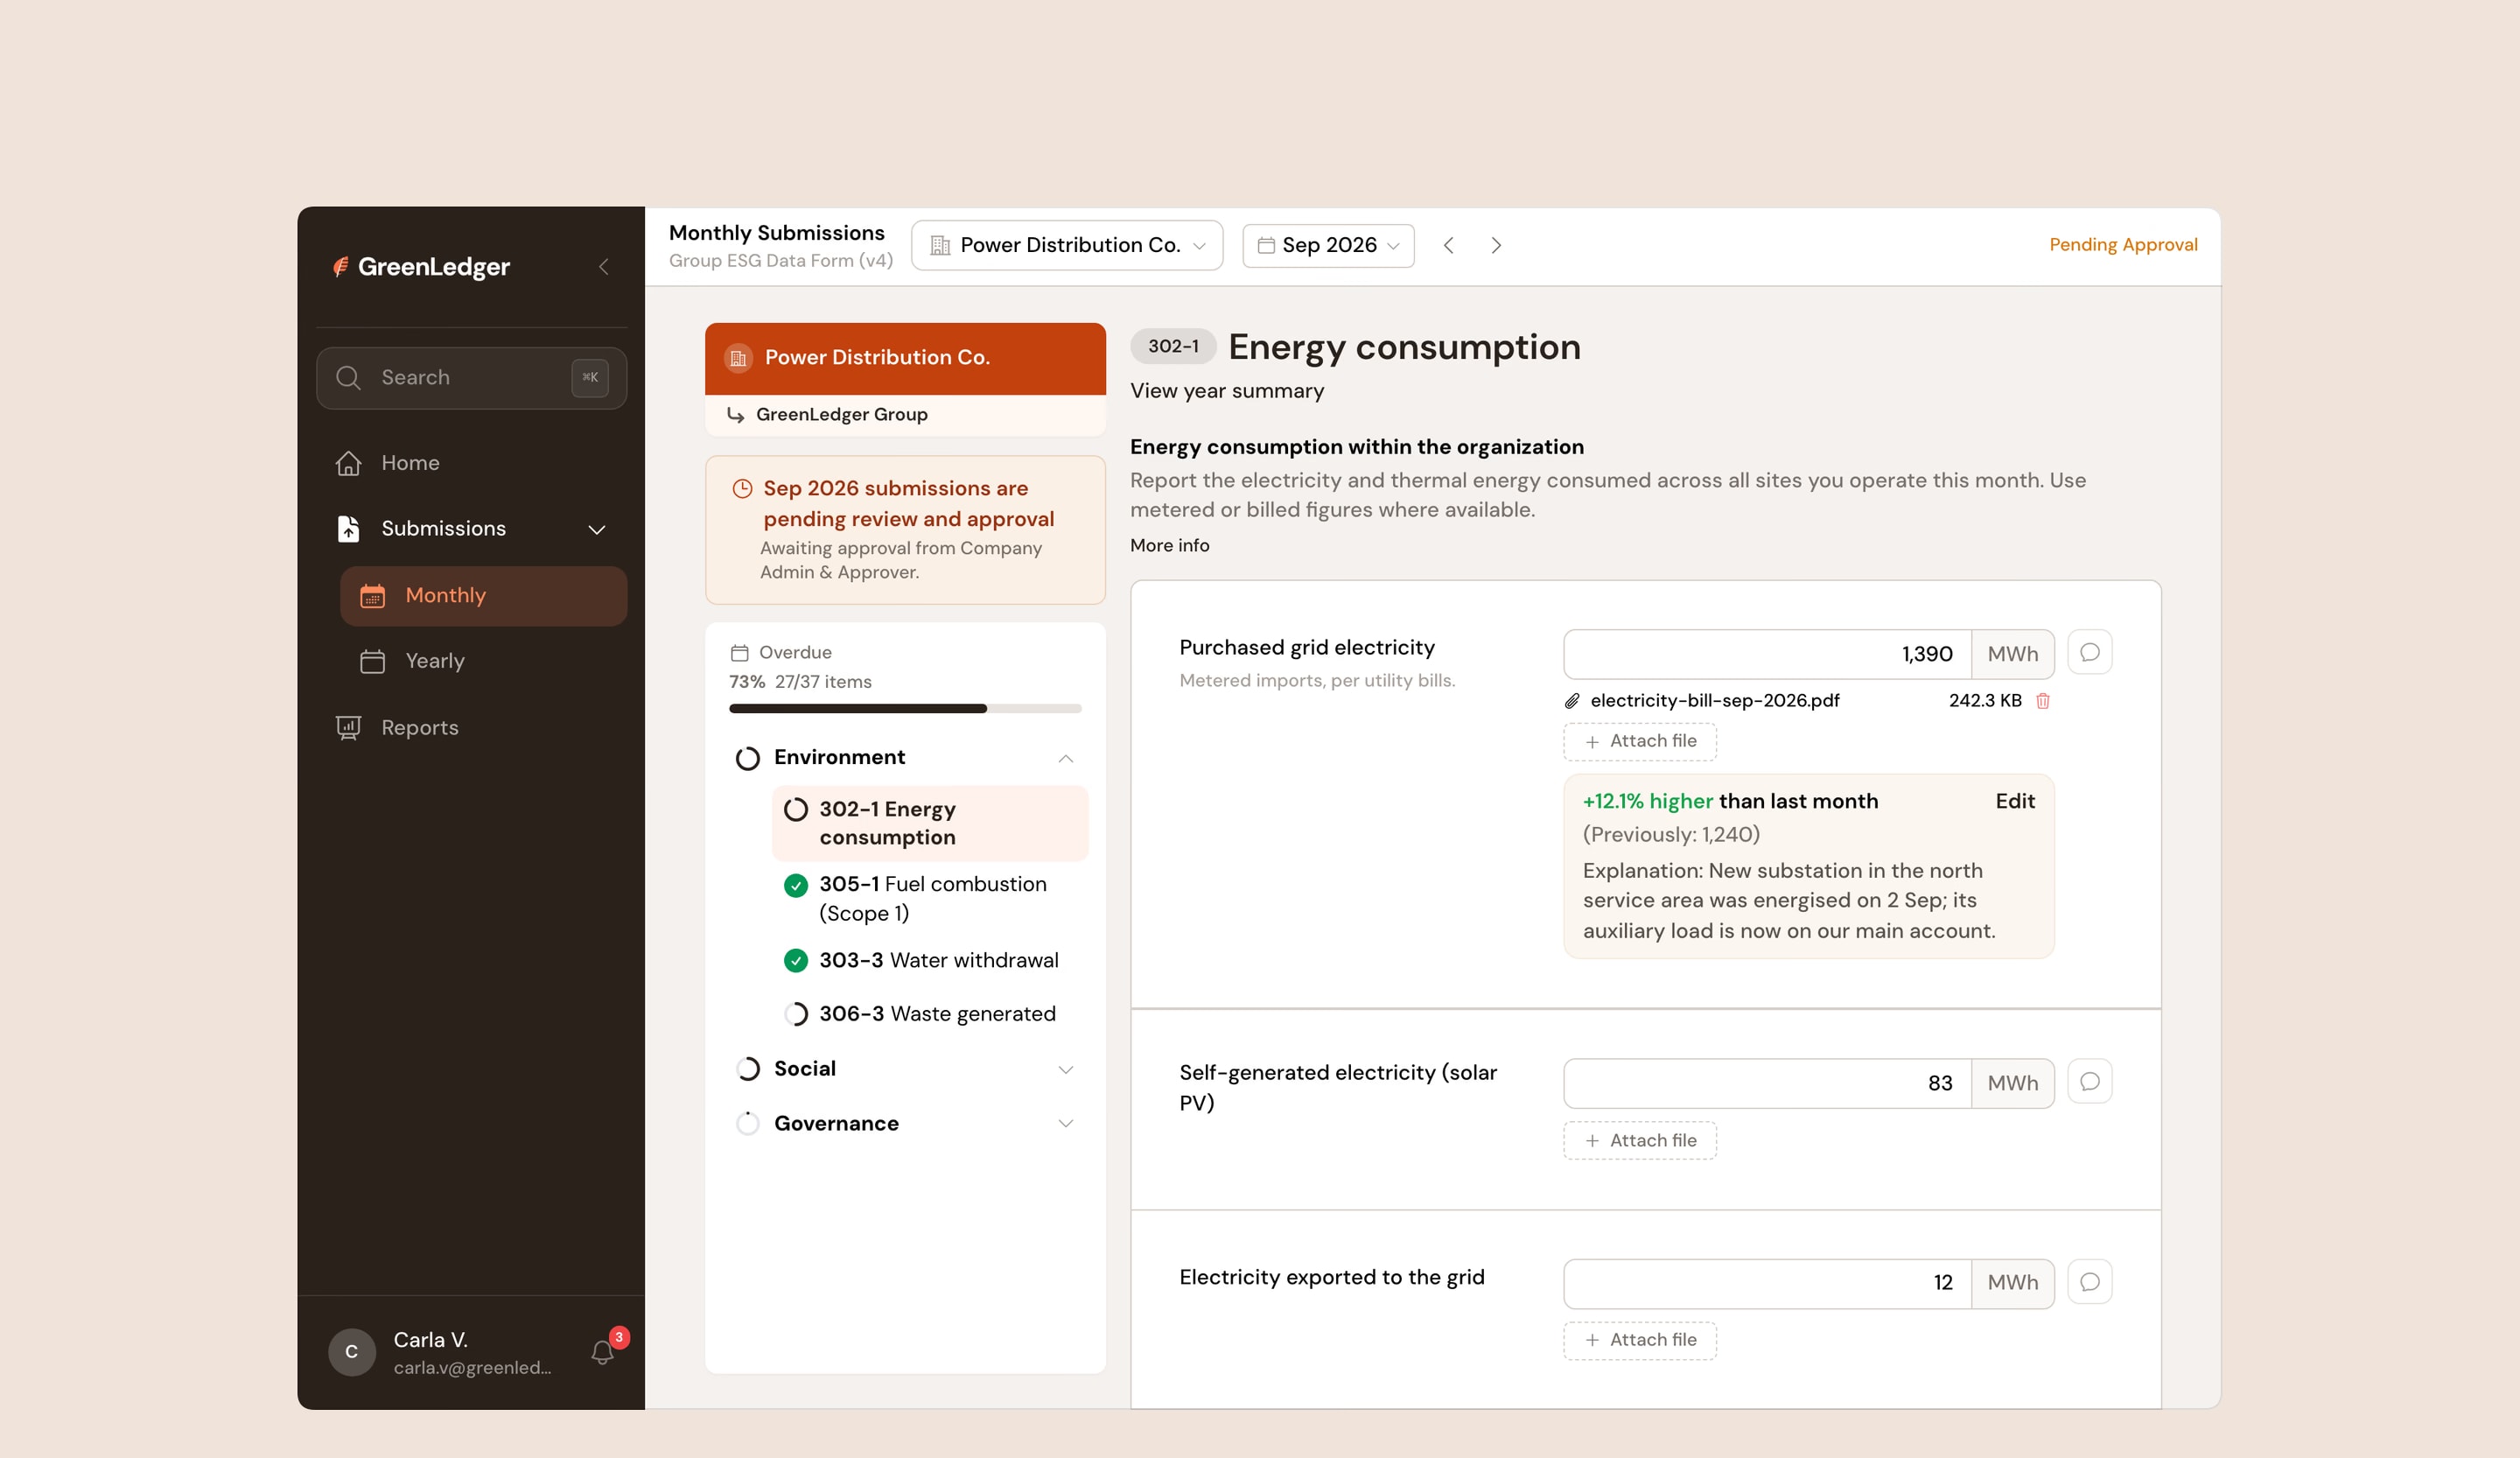
Every one of those companies has to report its environmental and social numbers, and the head office has to combine them into one group report. Each company sent its data by email and spreadsheet, in its own format and on its own schedule. The central team chased submissions, recalculated figures by hand, and couldn’t easily show who reported what.
What we built
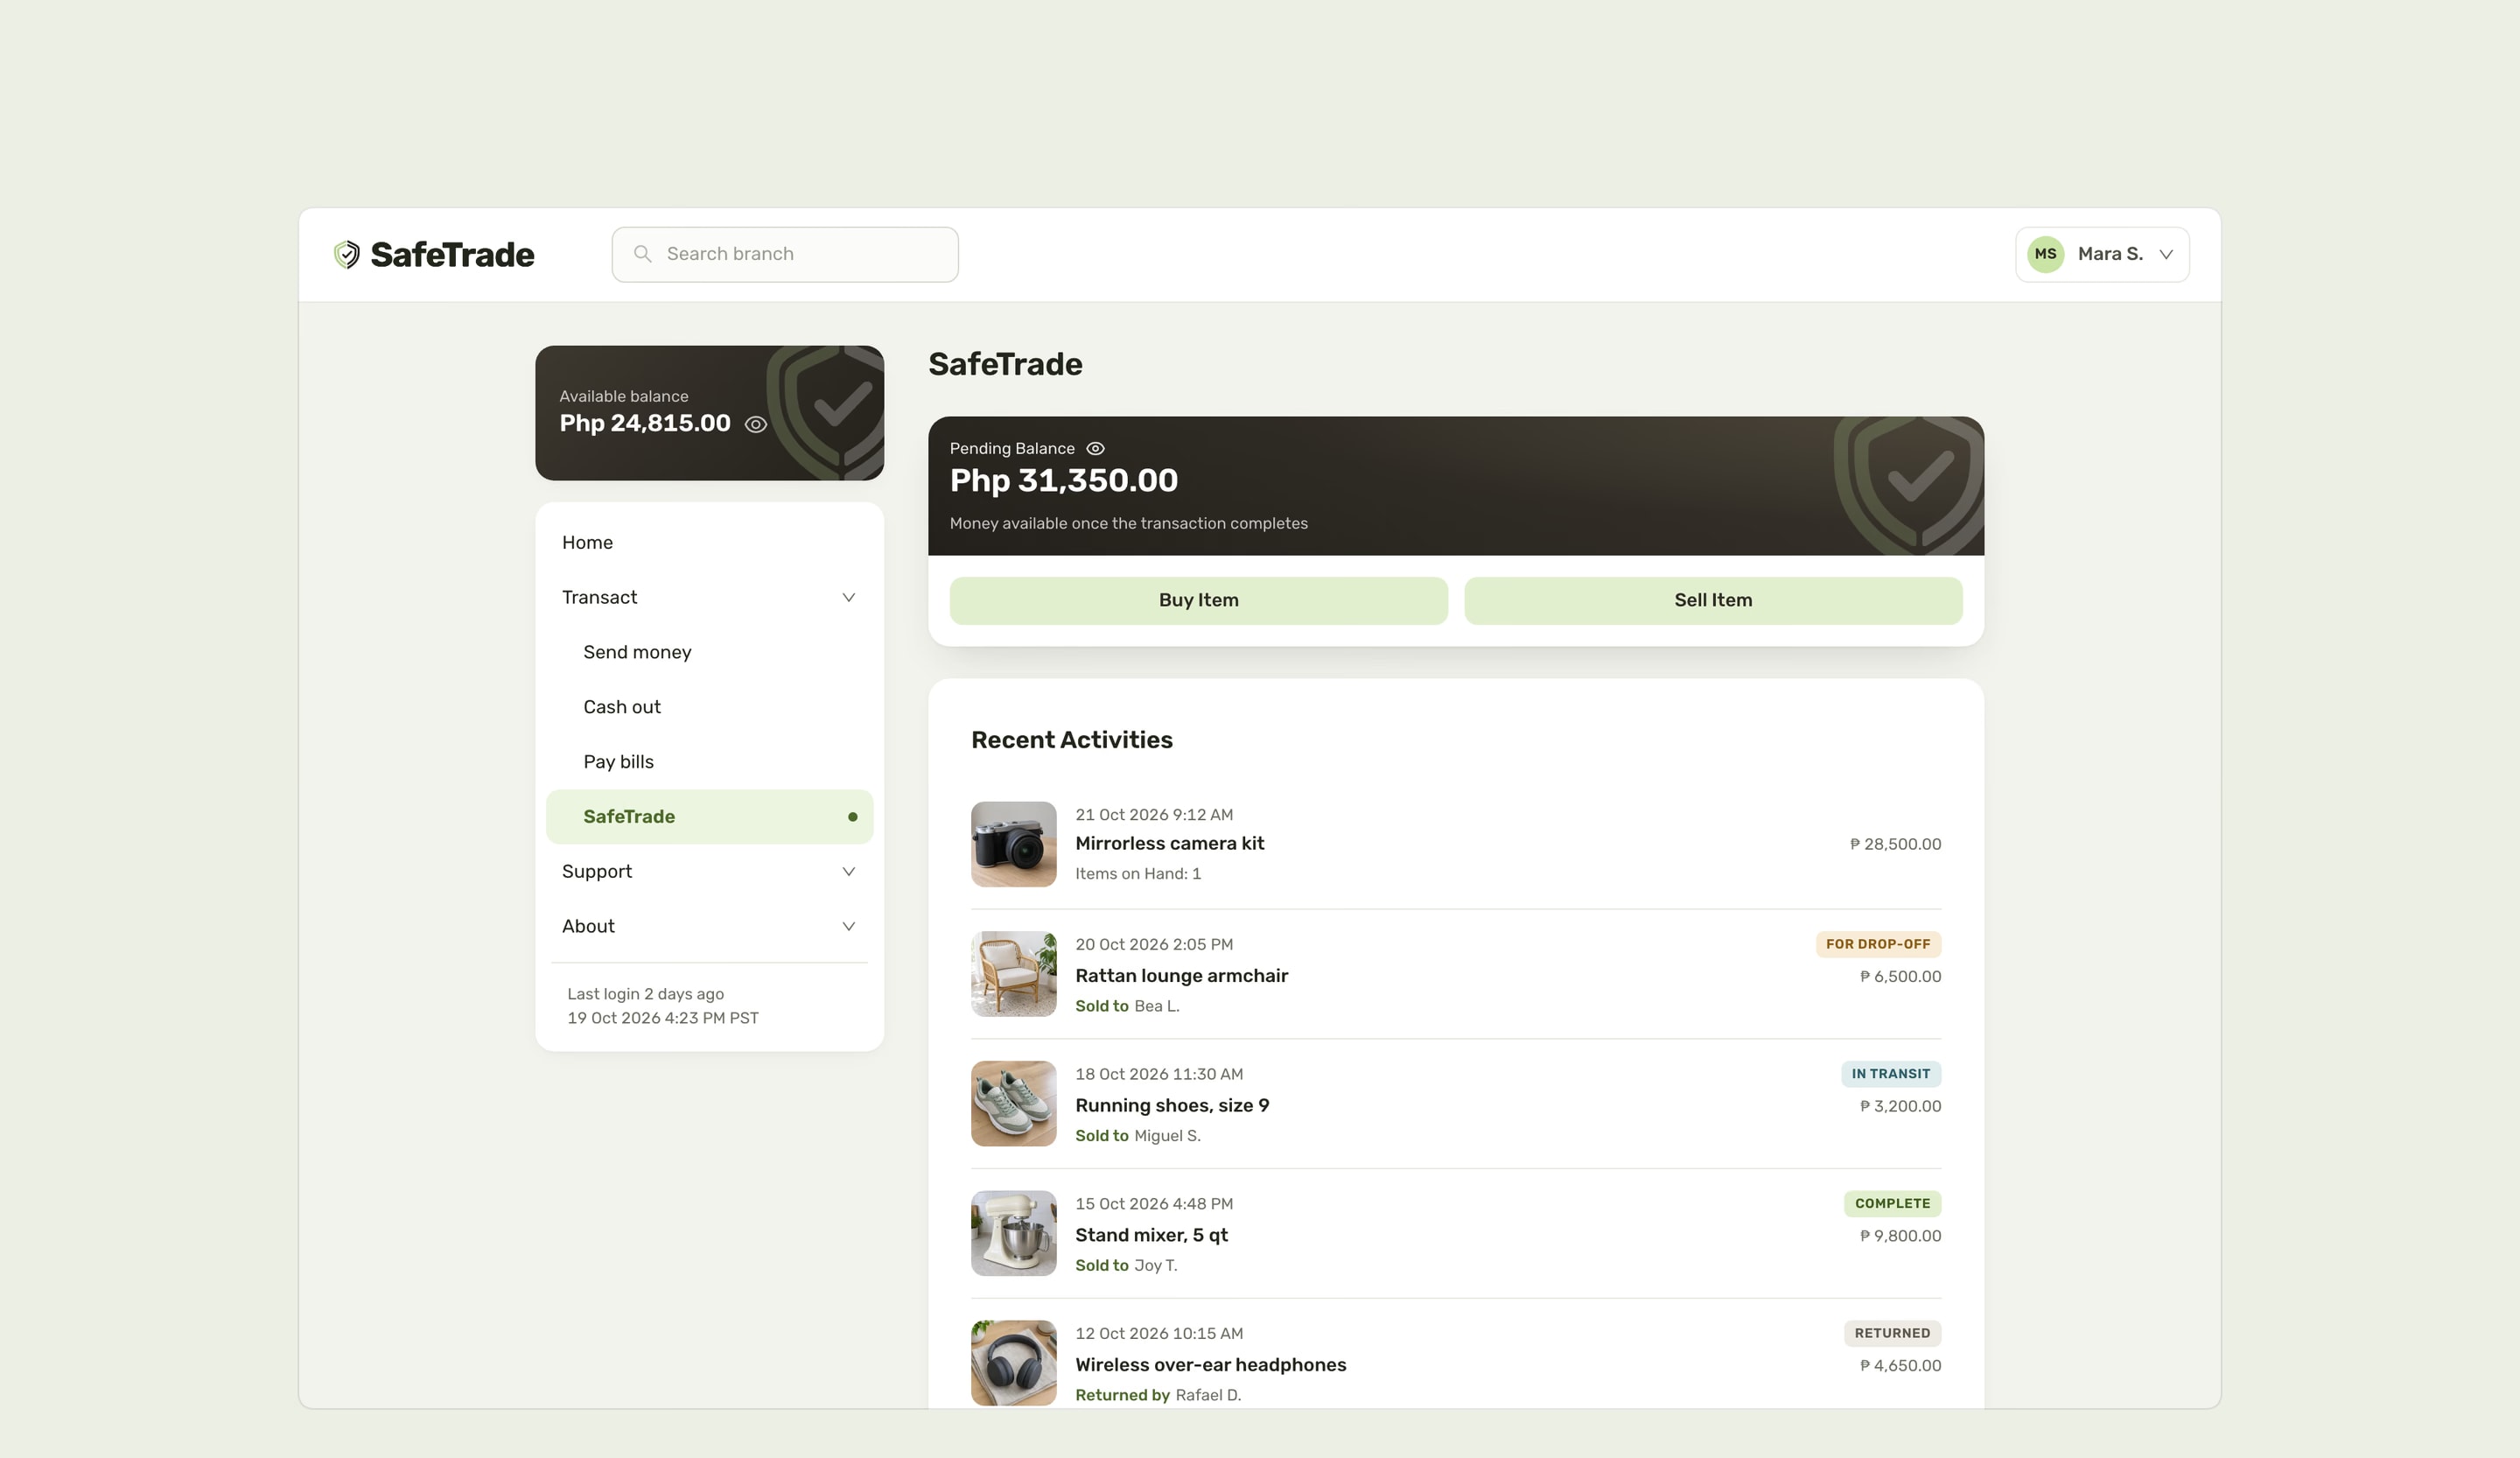
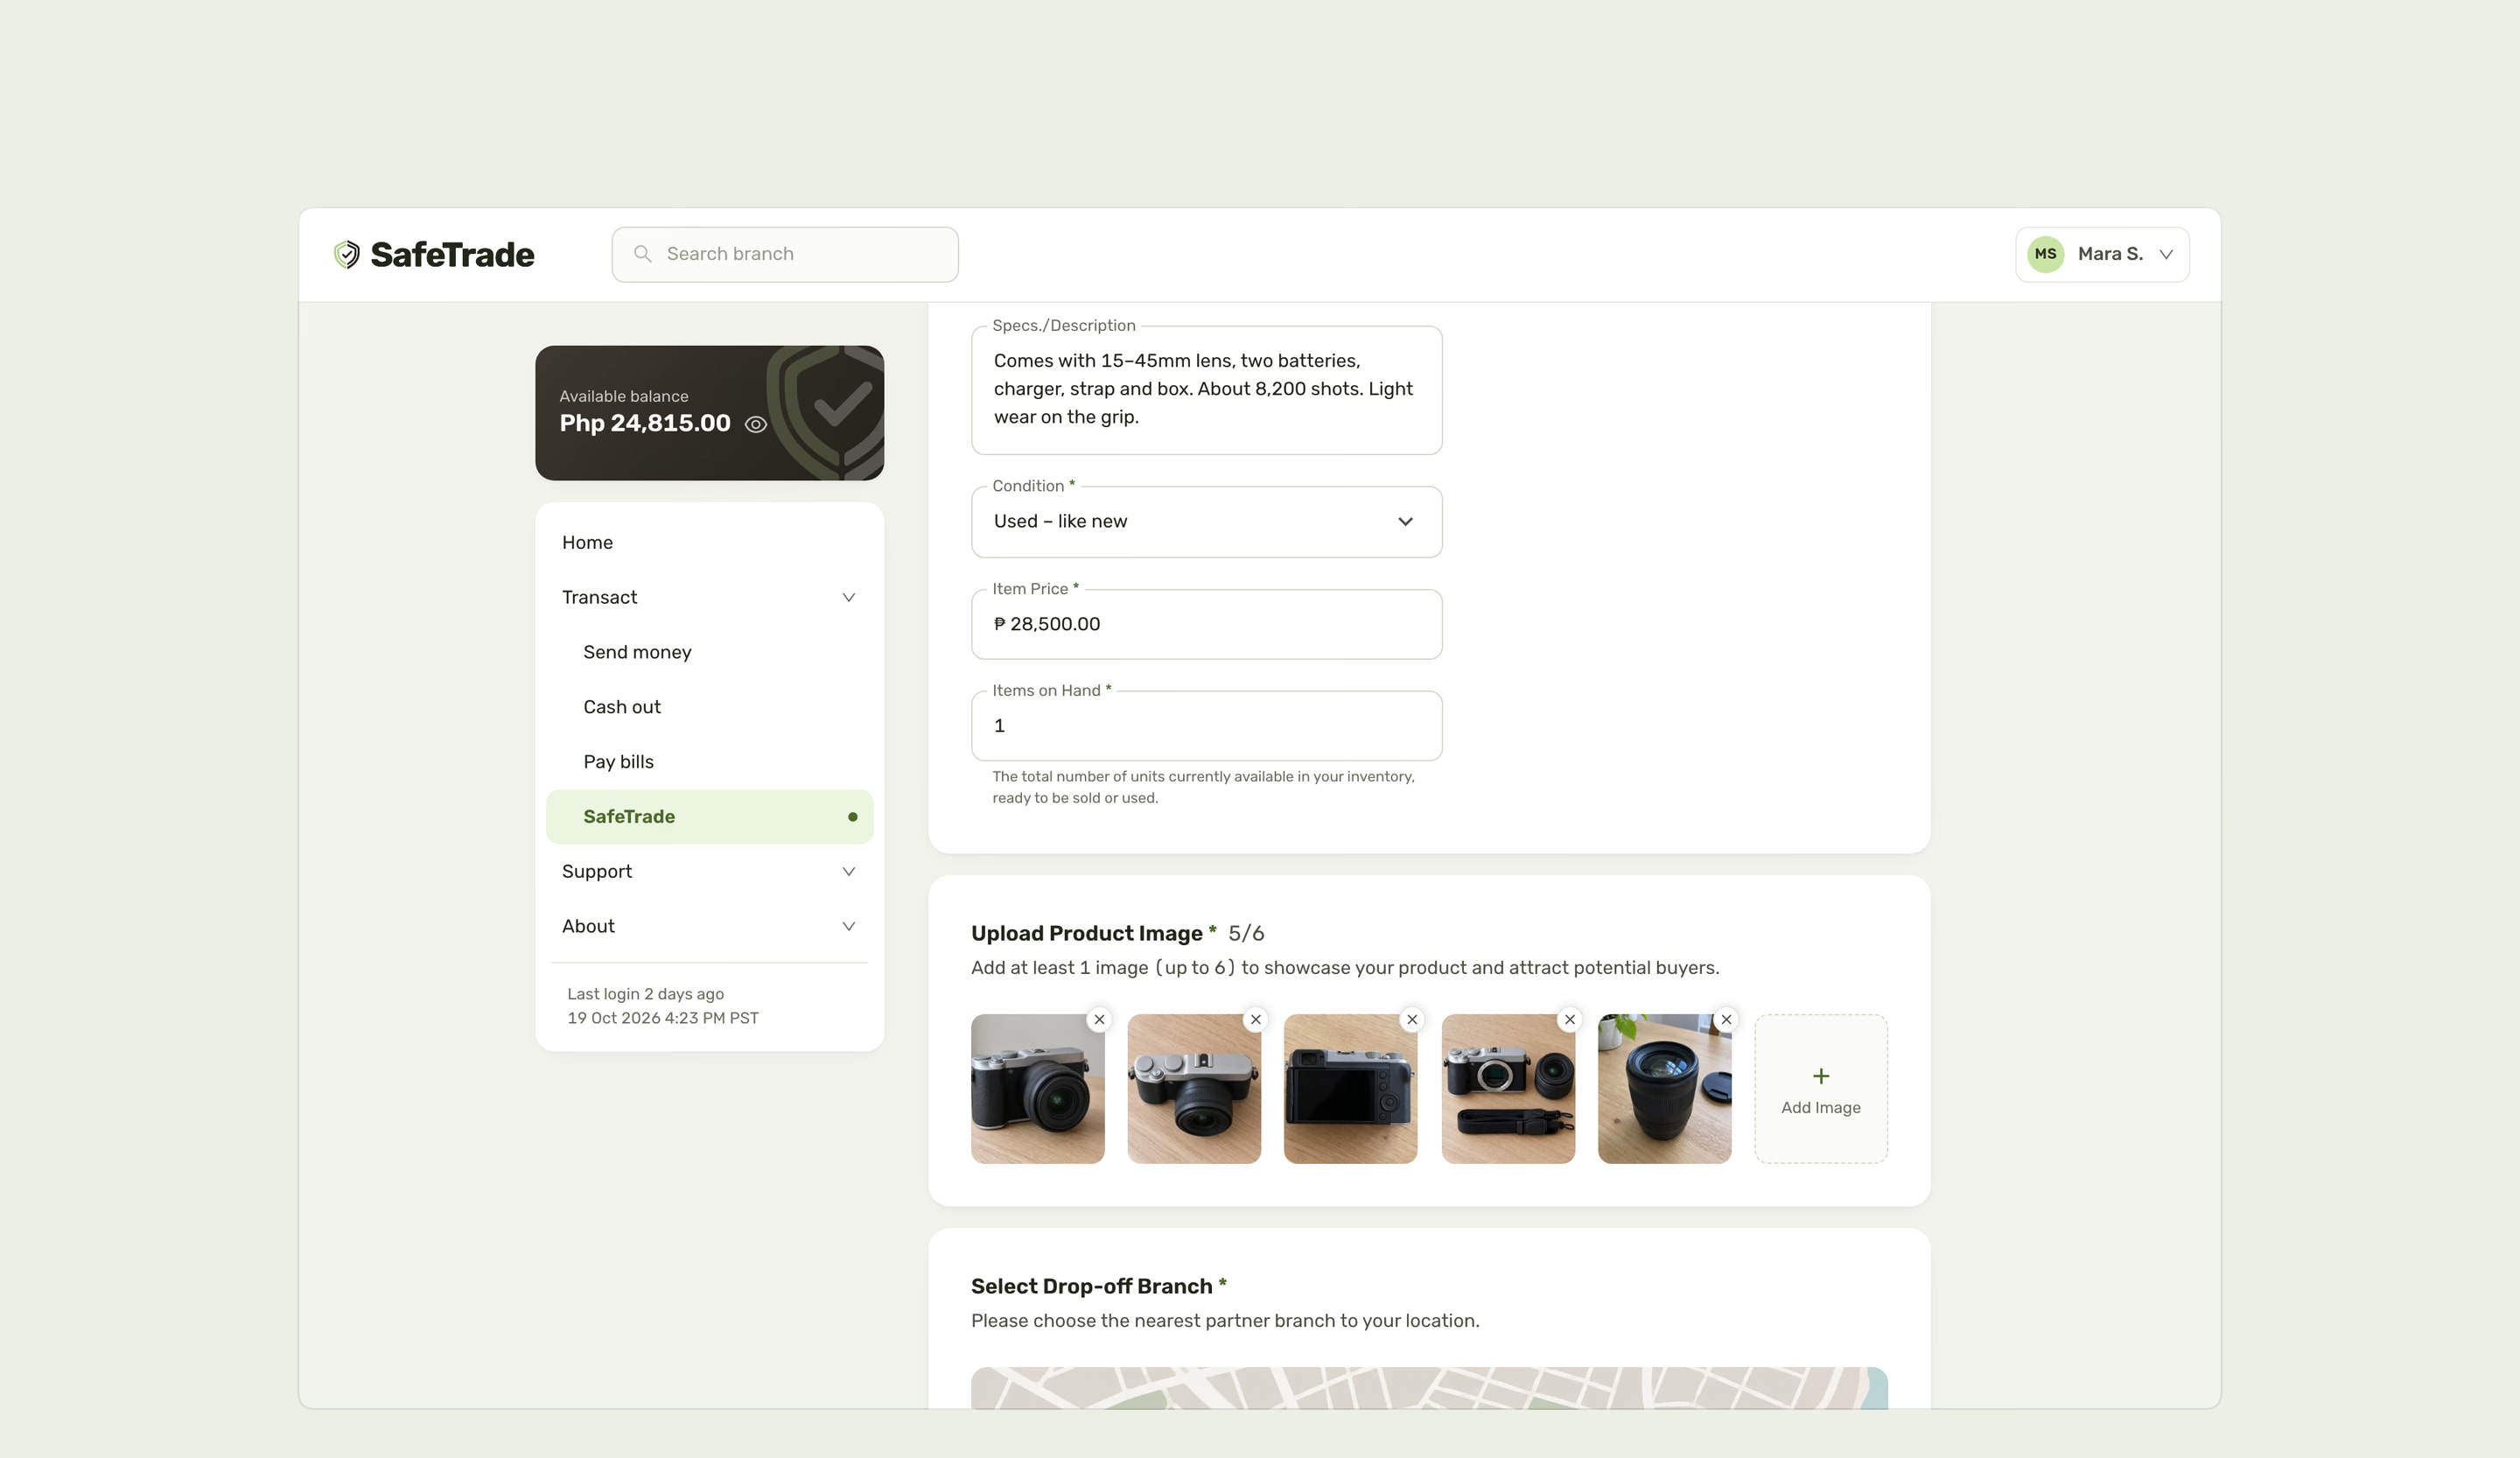
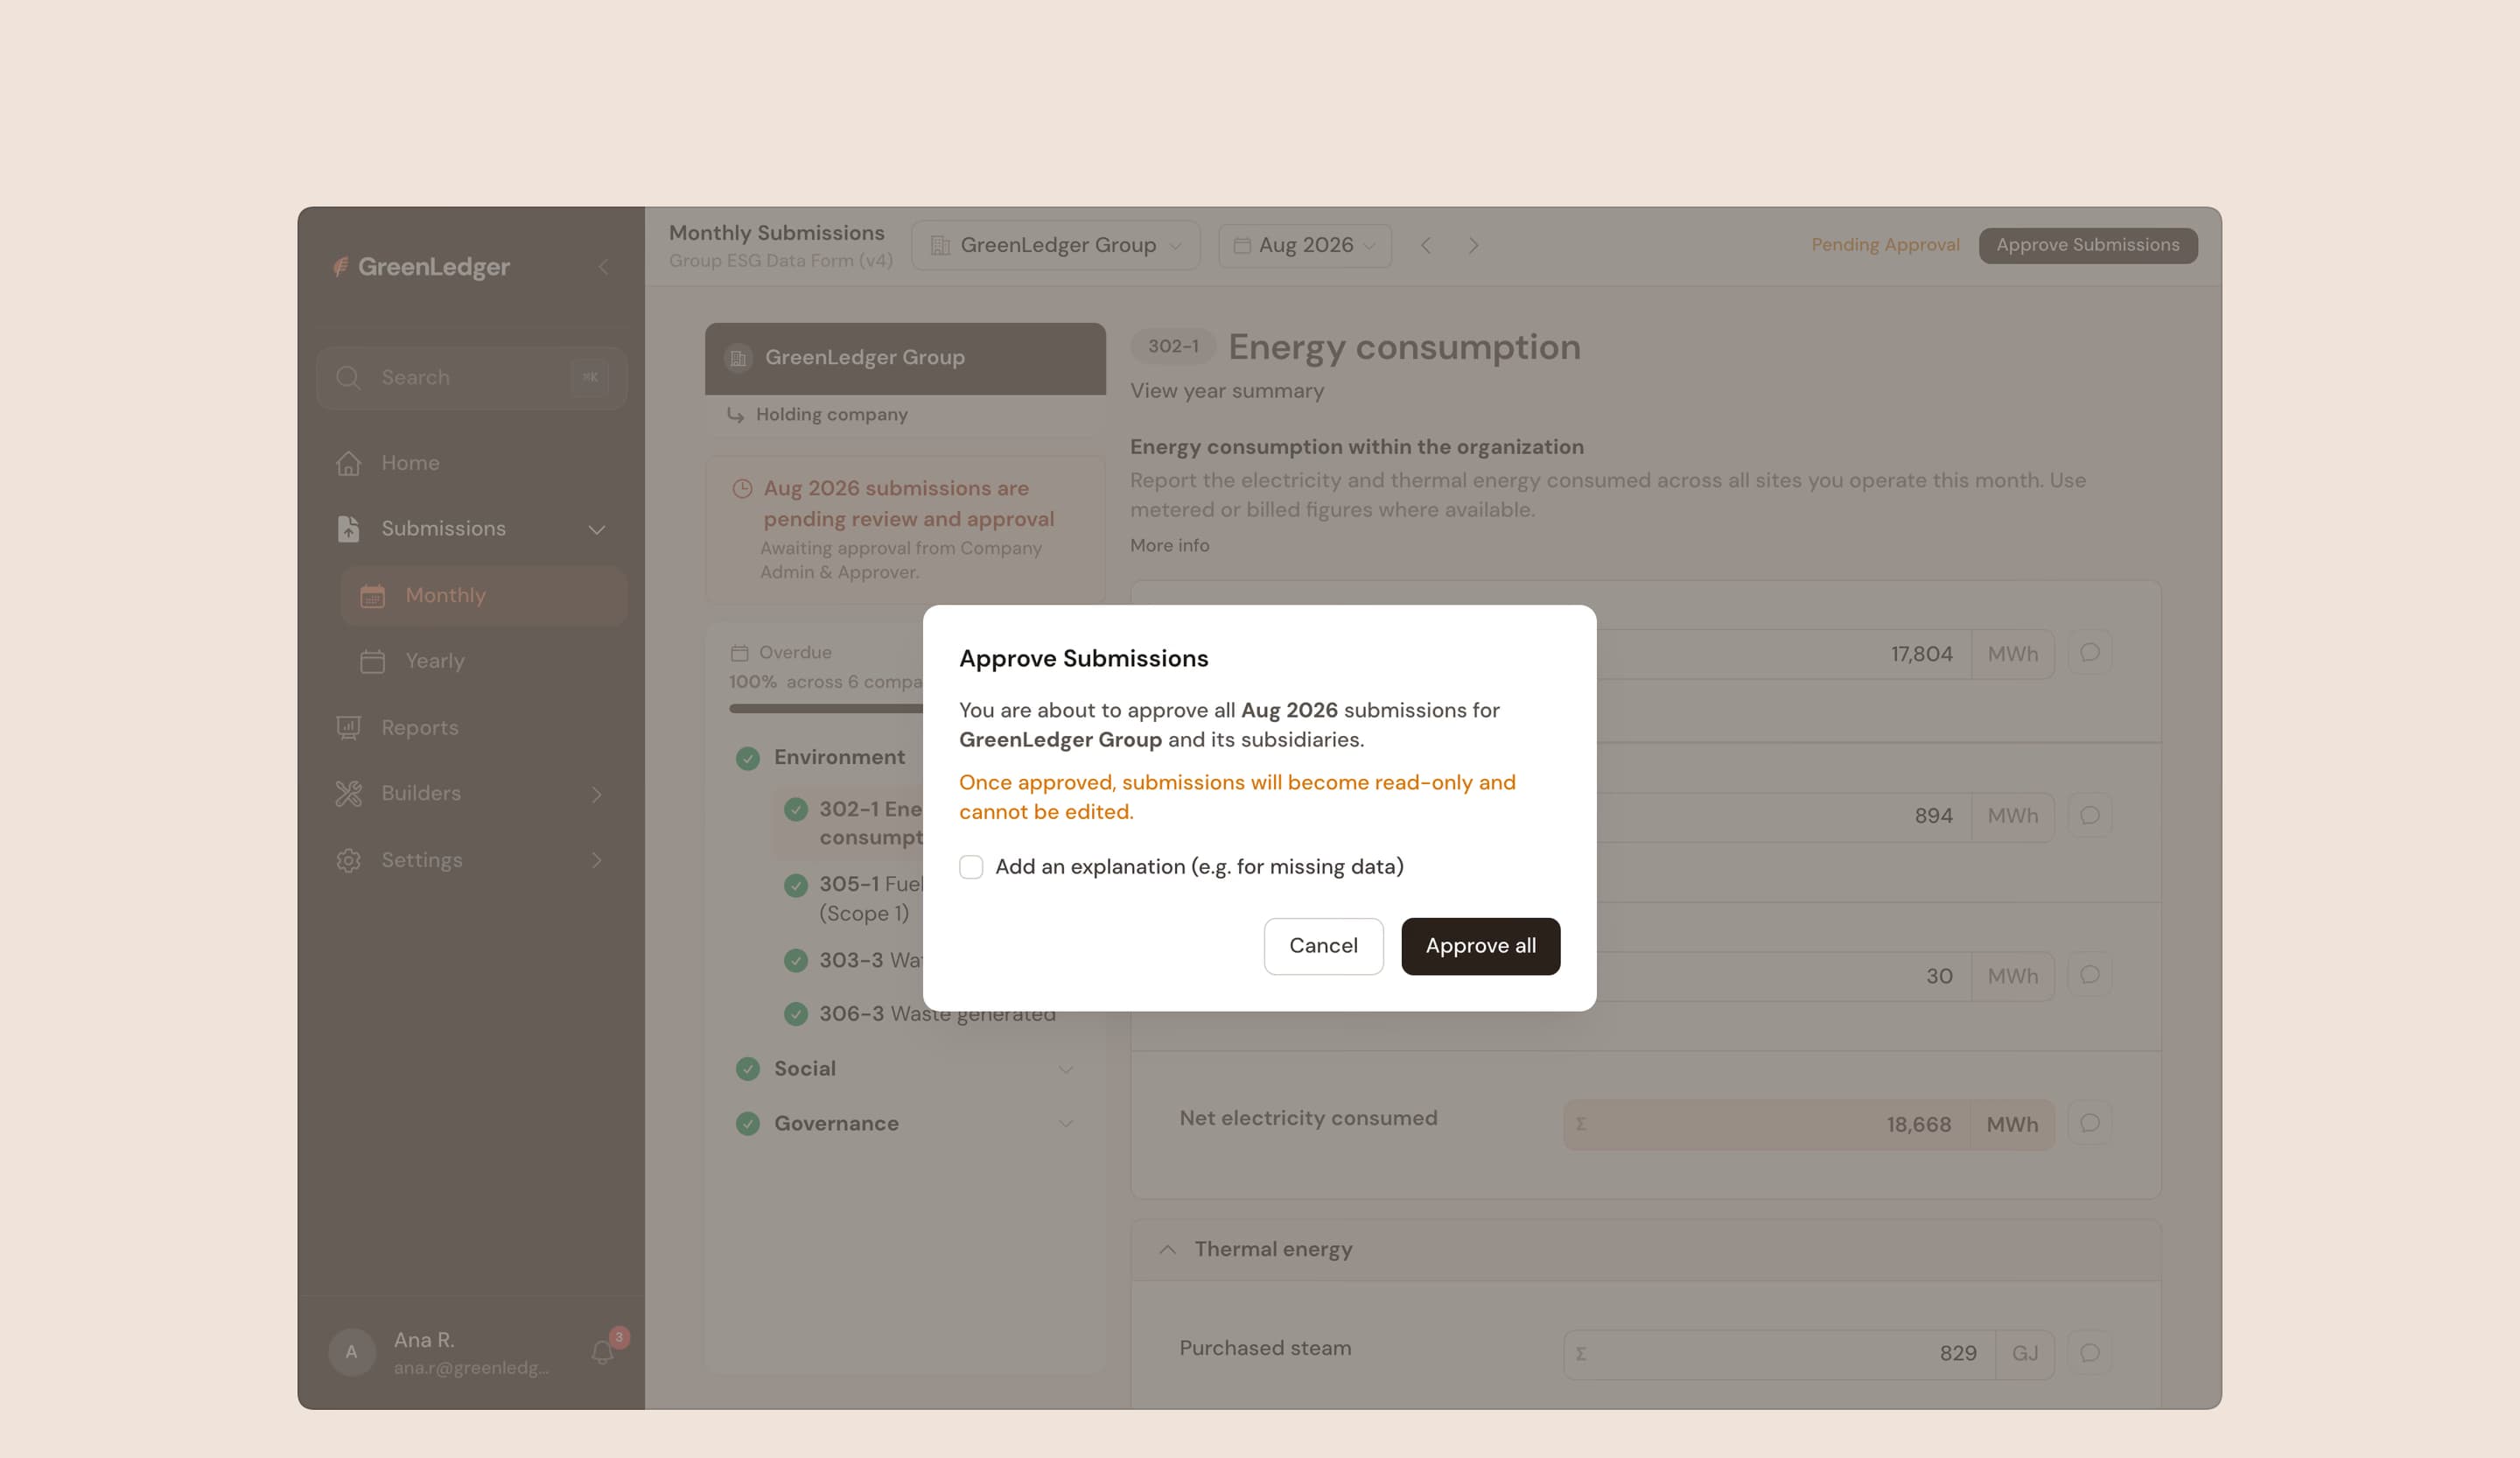
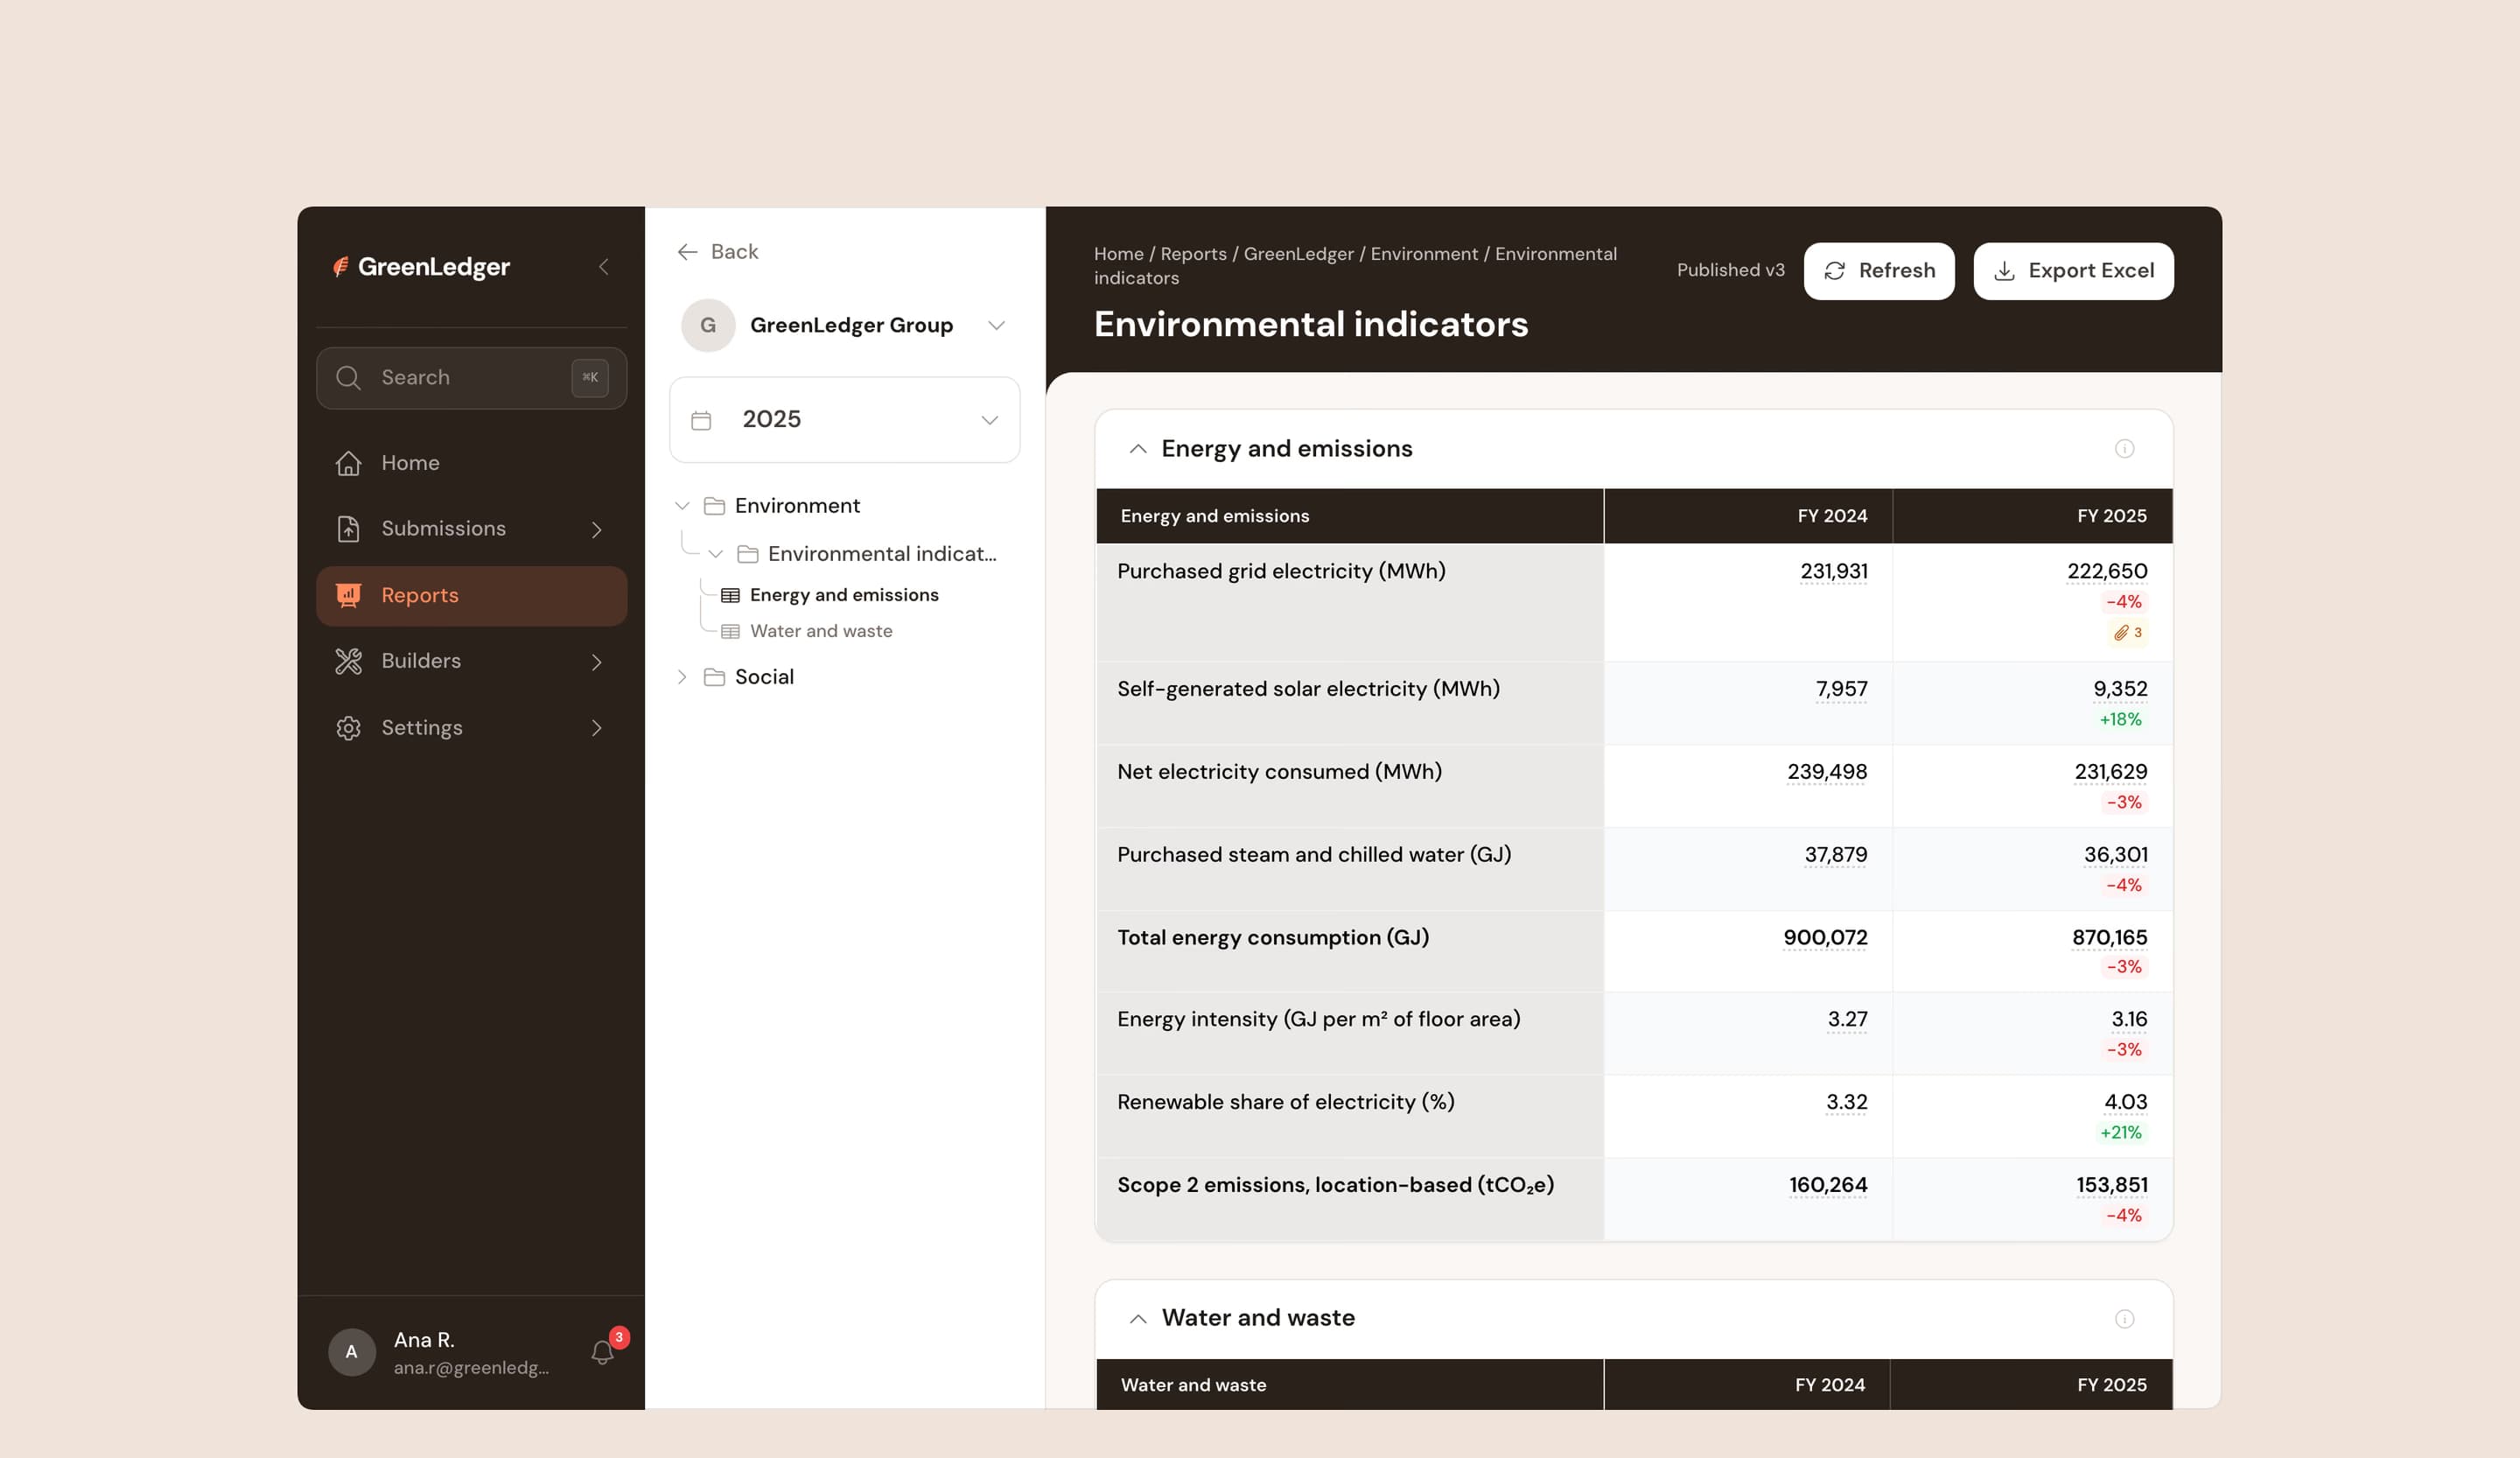
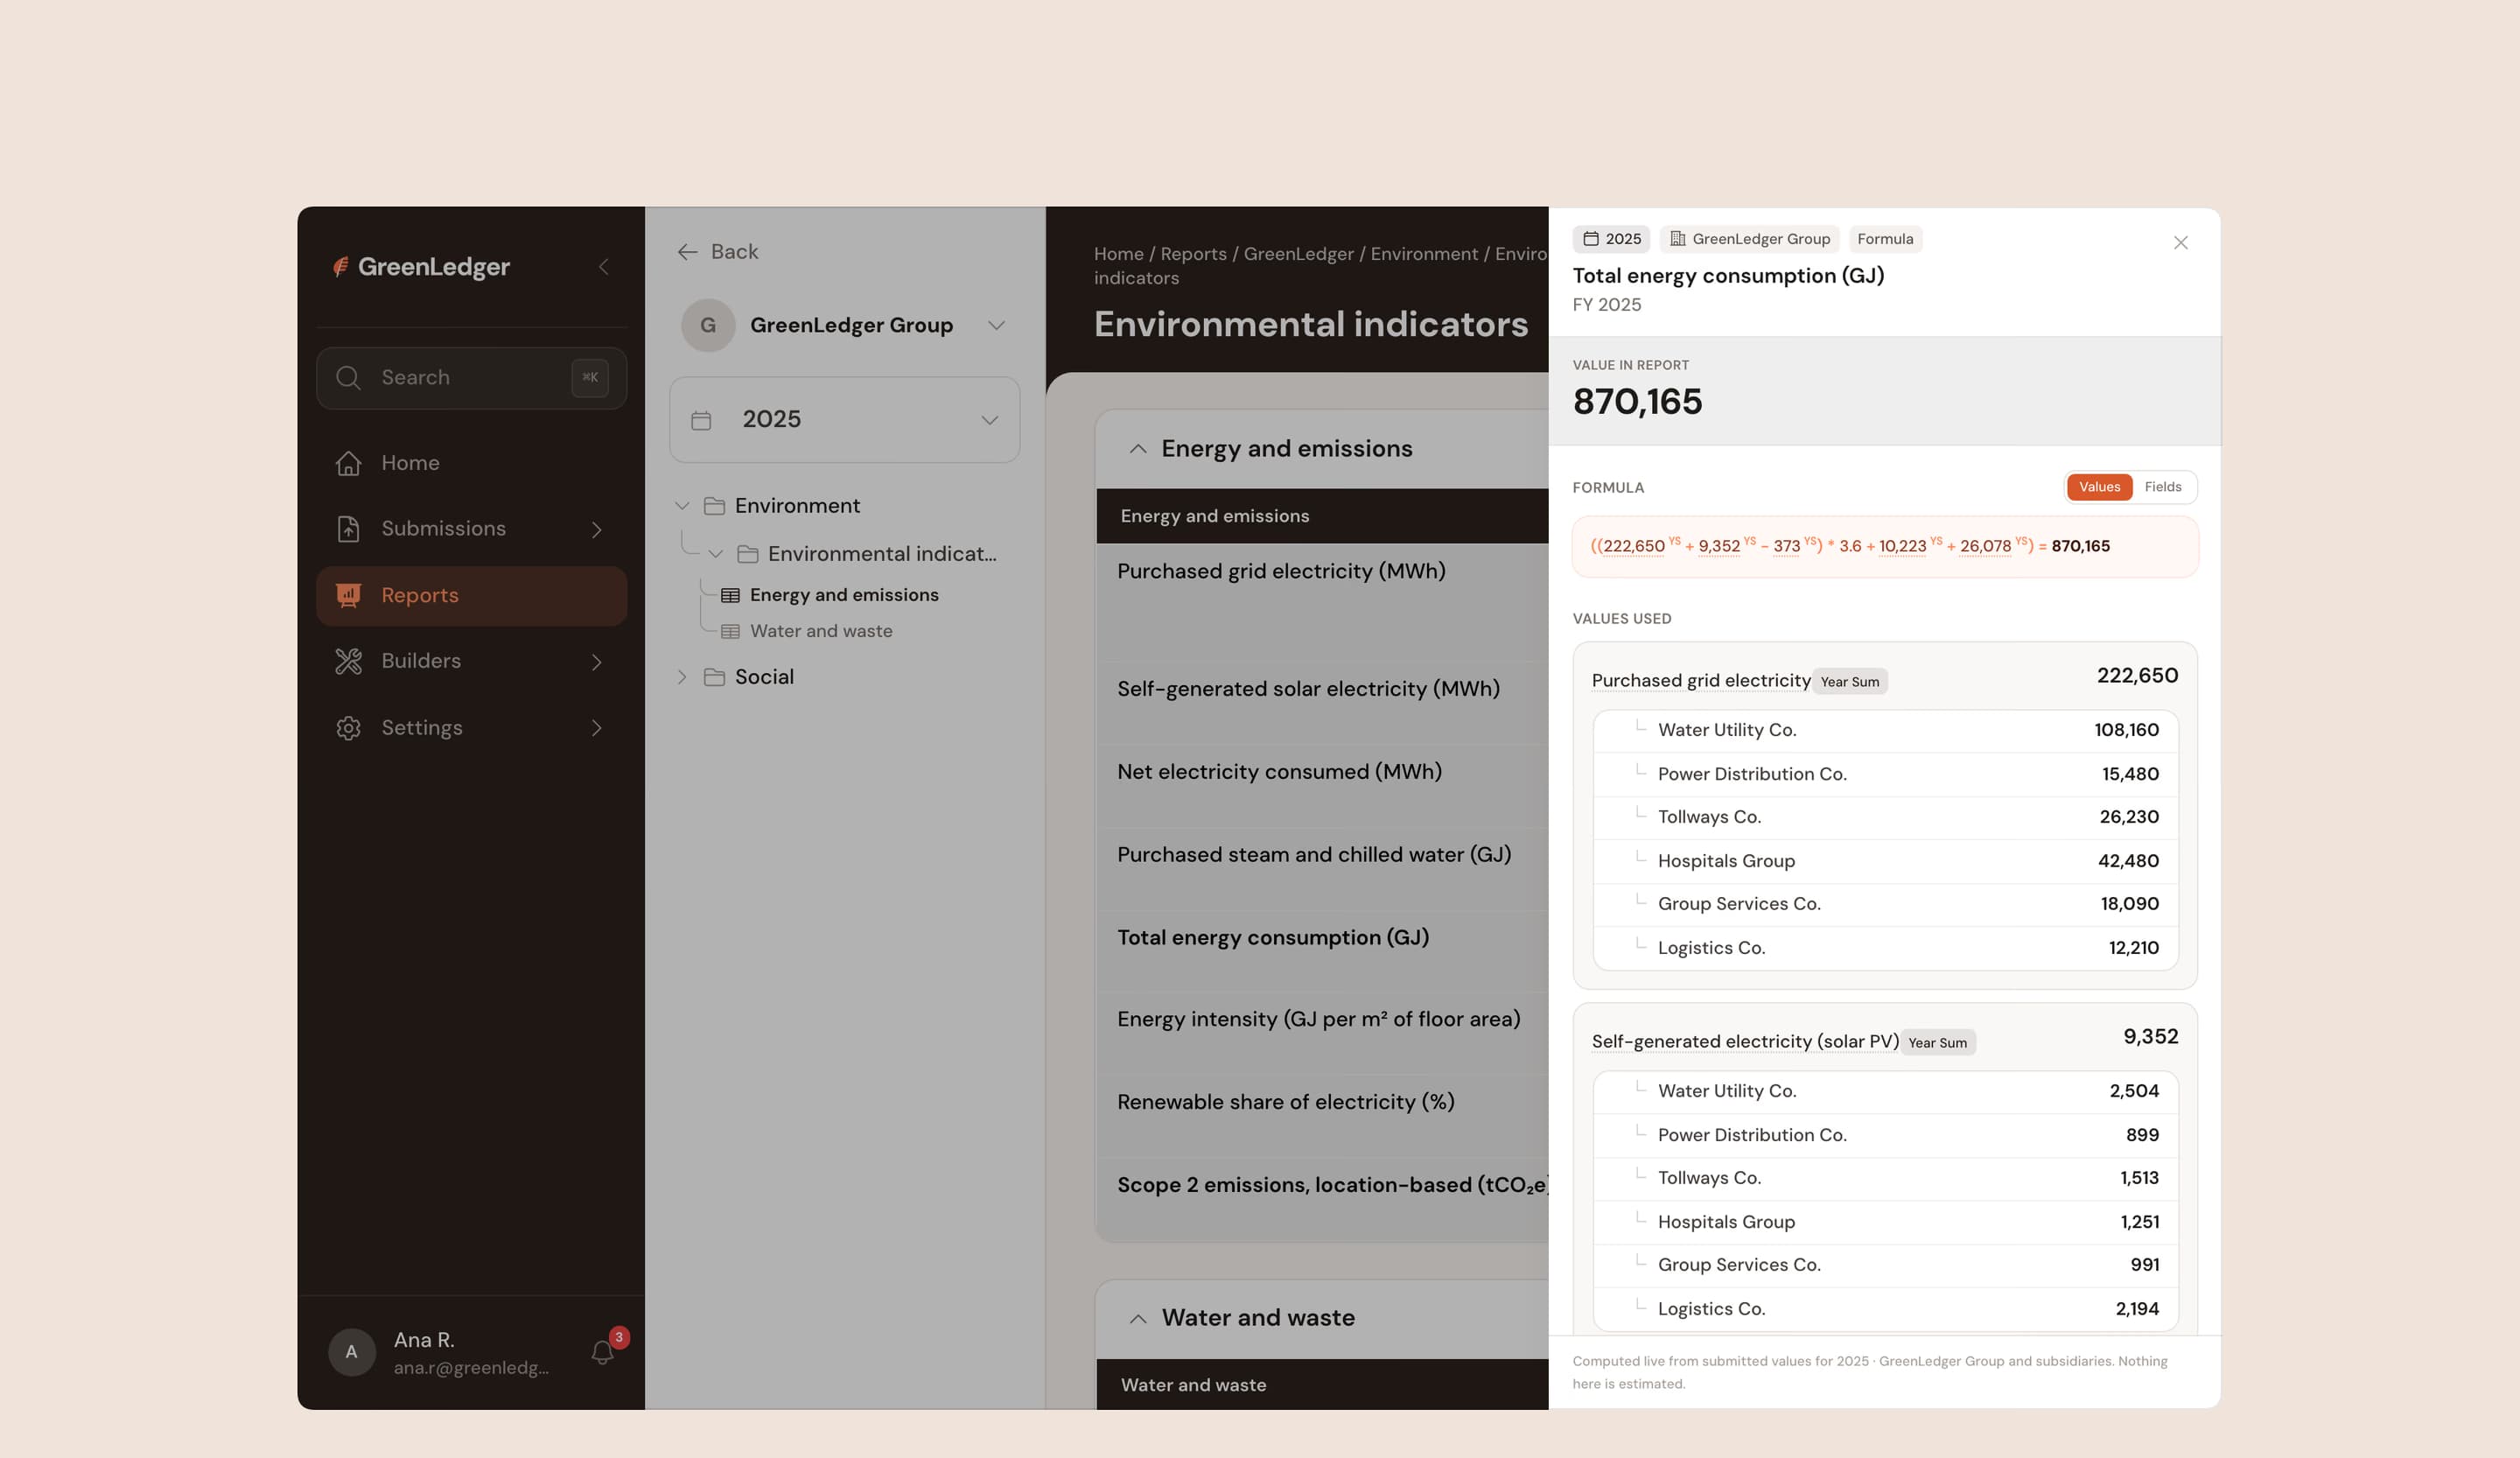
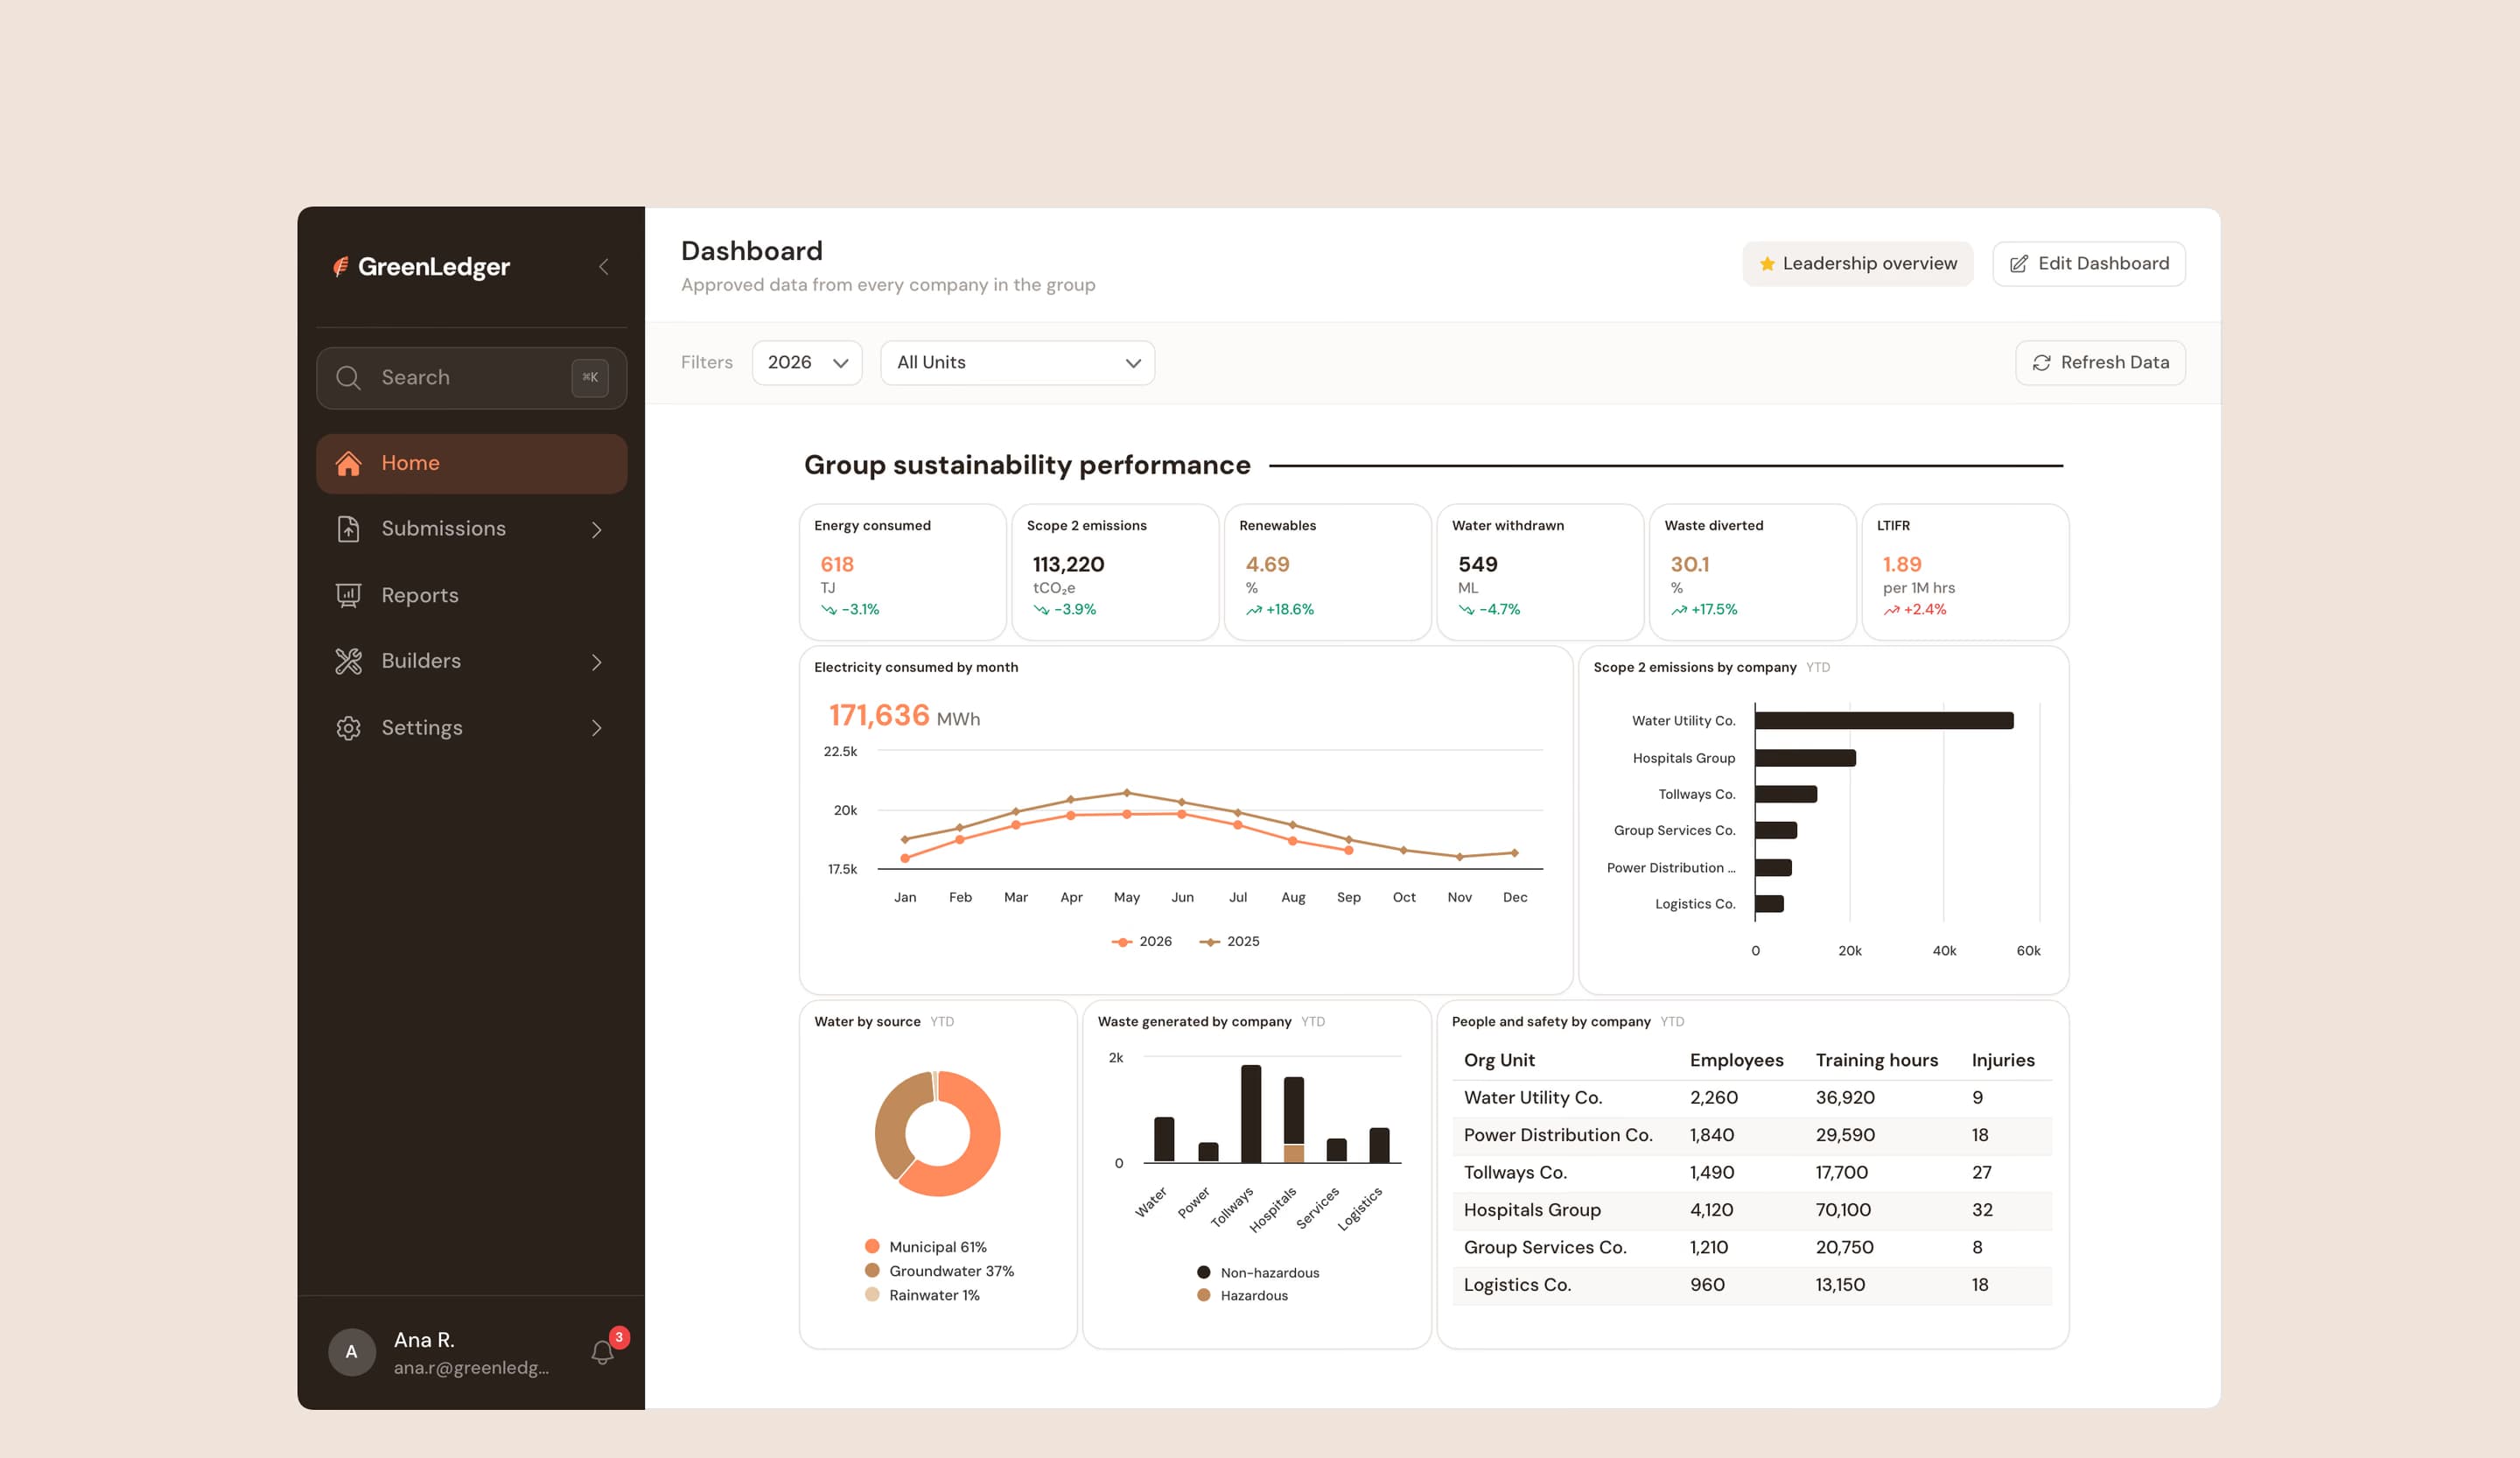
We built one platform for the whole group. Each company enters its data into the same set of fields for each reporting period. The central team reviews and approves it, and the platform calculates the indicators automatically. Leadership sees one dashboard, and the group’s public sustainability website pulls from the same approved data.
The result
Every company in the group reports through one system.
Numbers are calculated once, so leadership and the public see the same figures.
The client signed off on testing with no critical issues, and we keep adding new reporting fields as the rules change.
More work
ConstructOS
From spreadsheets to one system in 26 days
RequestFlow
From chat threads to one system in 4 weeks
EstateCore
From three systems to one in 8 weeks